A New Unifying Issue: Just About Everyone Hates Data Centers
Recent election results and evidence from states show misgivings about the growth of AI and the ramifications for energy costs and the environment.
Current Access Level “I” – ID Only: CUID holders, alumni, and approved guests only
Get the latest as our experts share their insights on global energy policy.
As diplomats meet in Brazil for COP30, global resolve to tackle the climate challenge appears badly frayed.

Hear in-depth conversations with the world’s top energy and climate leaders from government, business, academia, and civil society.
Elected officials face huge challenges when it comes to energy policymaking. They have very little time to learn complicated, nuanced issues. They're bombarded by information — some of...

Find out more about our upcoming and past events.
In this Roadmap presentation, coauthors examine data centers' energy use, strategies for improving data centers' energy efficiency, greenhouse gas emissions from data centers, strategies for using data centers...

Insights from the Center on Global Energy Policy
This Energy Explained post represents the research and views of the author. It does not necessarily represent the views of the Center on Global Energy Policy. The piece may be subject to further revision. Contributions to SIPA for the benefit of CGEP are general use gifts, which gives the Center discretion in how it allocates these funds. Rare cases of sponsored projects are clearly indicated.
For a full list of financial supporters of the Center on Global Energy Policy at Columbia University SIPA, please visit our website at Our Partners. See below a list of members that are currently in CGEP’s Visionary Circle. This list is updated periodically.
In 2022, European Union nuclear and hydro generation dropped by 118 terawatt-hours (TWh) and 71 TWh, respectively, preventing gas-fired generation from dropping and contributing to the gas crisis. 2023 offered the opposite picture: a drop in total generation as well as in coal- and gas-fired generation helped to stabilize European gas spot prices, while clean sources of generation such as wind and solar continued to increase and nuclear and hydro recovered.
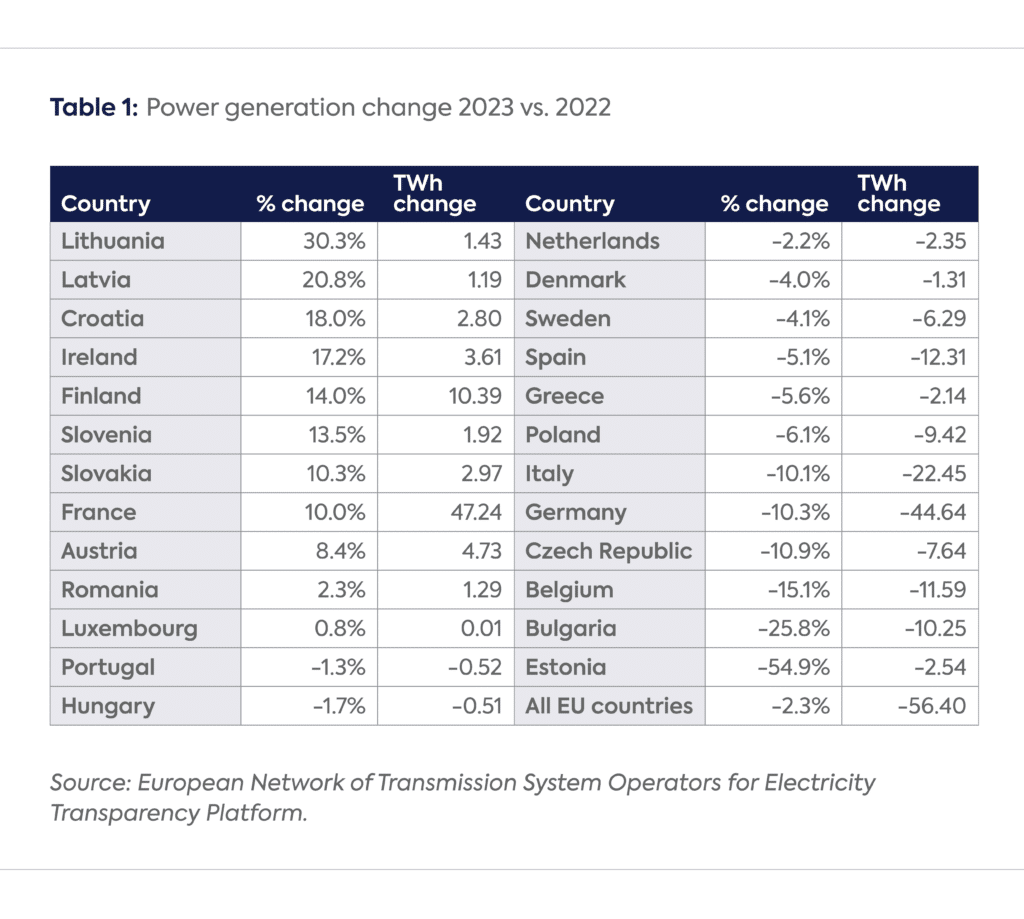
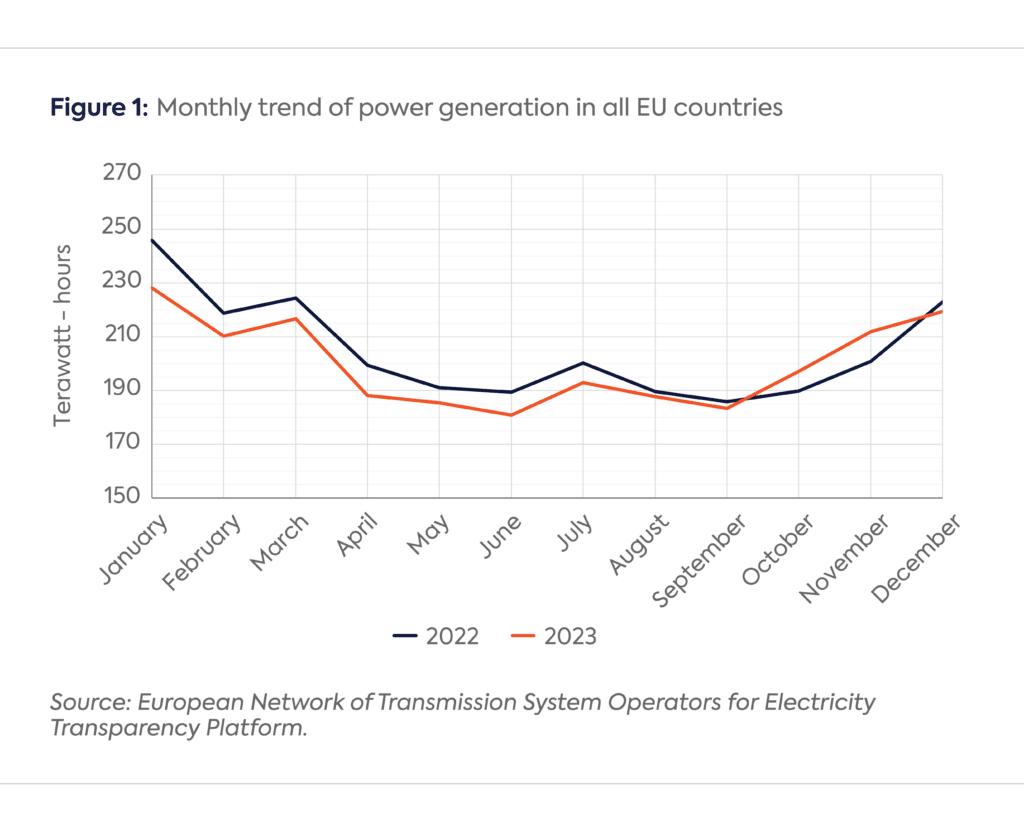
At the transmission level, the EU’s electricity generation dropped by 2.3 percent (-56.4 TWh) compared to 2022 (Figure 1).[1] The drop was the highest in January 2023 (-7.2 percent), when the energy crisis was still acute. However, EU generation increased slightly (+2.4 percent) during the last quarter compared to the same period in 2022. The overall EU-wide drop could be due to various responses to the 2022 energy crisis (energy efficiency or a change in consumer behavior triggered by policies or high power prices) as well as an increase in behind-the-meter (solar) consumption, which is not reported at the transmission level.[2]
Countries where significant generation reduction happened in 2023 include Estonia, Bulgaria, and Belgium (Table 1). However, some countries experienced significant power production increases in 2023. These generation changes at a country level could be due to changes in electricity trade as well as a demand reduction at the transmission level. In Germany, power generation dropped by 11 percent, due to an estimated 3 to 4 percent drop in consumption and an increase in imports.[3] In France and Spain, weather-adjusted consumption dropped by 3.5 percent and 2.1 percent in 2023, respectively.[4]
In 2023, EU hydro generation recovered by 50.6 TWh, but still remained below 2021 levels. All monthly hydro levels increased year-on-year due to wetter conditions than in 2022, except in Southern Europe, which experienced a particularly hot and dry summer.[5] The highest relative gain was experienced by Portugal, which almost doubled hydro generation to reach the 2021 level. In absolute terms, Italy and France experienced the highest increases (9.9 TWh and 9.2 TWh), but their hydro levels in 2023 remain below 2021 levels. In contrast, Sweden, the region’s largest hydro producer, experienced a drop comparable to 2022 (around 4 TWh).
In aggregate, nuclear generation increased by a modest 8.9 TWh, and is more than 100 TWh below the 2021 level (697.8 TWh). Germany lost 26.1 TWh (-79.5 percent from 2022 or -90 percent from 2021) as the country’s last three nuclear power plants were decommissioned. Belgium also disconnected two nuclear plants (Doel 3 in September 2022 and Tihange 2 in January 2023) following its 2003 legislation to phase out nuclear by 2025, which resulted in a decrease of 10.4 TWh in 2023 versus 2022.[6] On the other hand, French nuclear rebounded from 2022 levels to 320 TWh as Électricité de France (EDF) successfully managed the production of plants affected by corrosion issues.[7]
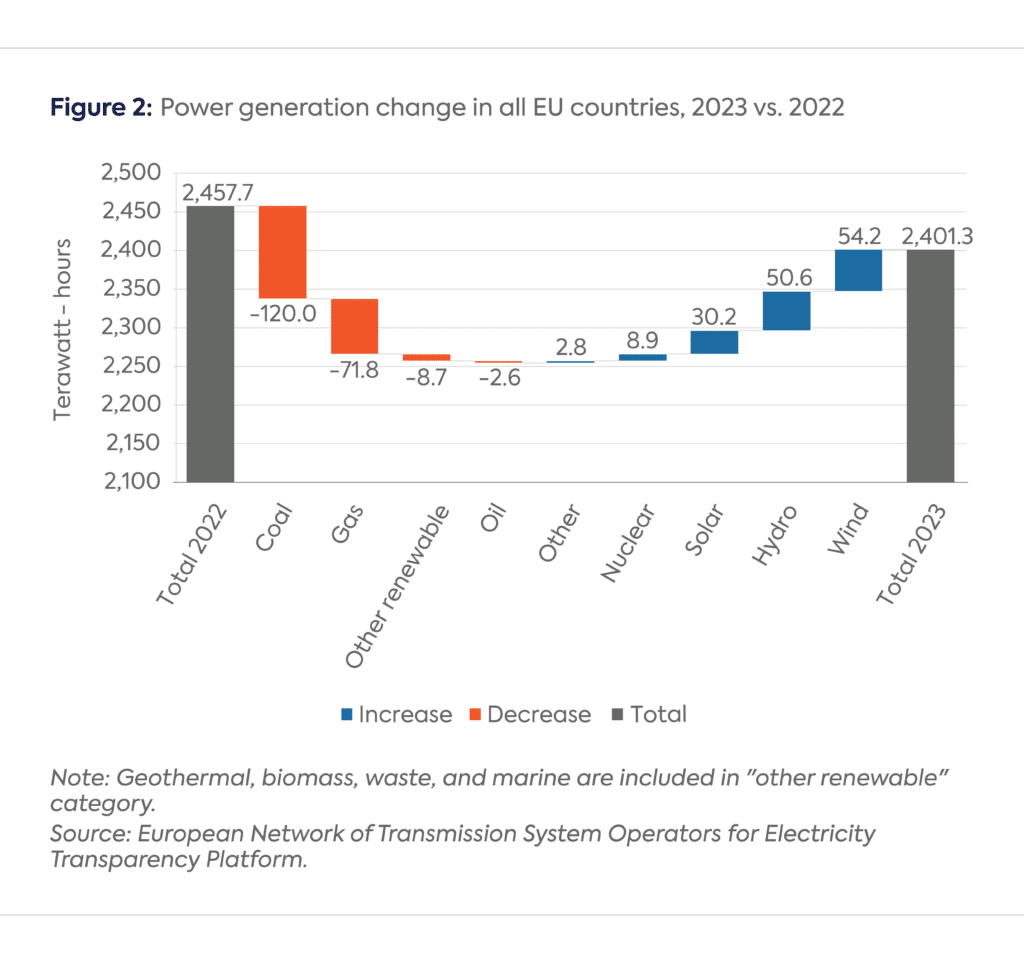
Additionally, wind and solar increased by 54.2 TWh and 30.2 TWh, respectively, compared to 2022 (Figure 2). A whopping 56 GW of solar capacity was installed in Europe in 2023, 40 percent more than in 2022.[8] In particular, Germany installed an additional 14.1 GW, followed by Spain (8.2 GW), Italy (4.8 GW), Poland (4.6 GW), and the Netherlands (4.1 GW). The total EU solar photovoltaic (PV) fleet now amounts to 263 GW, up 27 percent from 207 GW in 2022. Germany continues to be the largest PV capacity holder with 82 GW, far ahead of Spain (36 GW) and Italy (29.5 GW).[9]
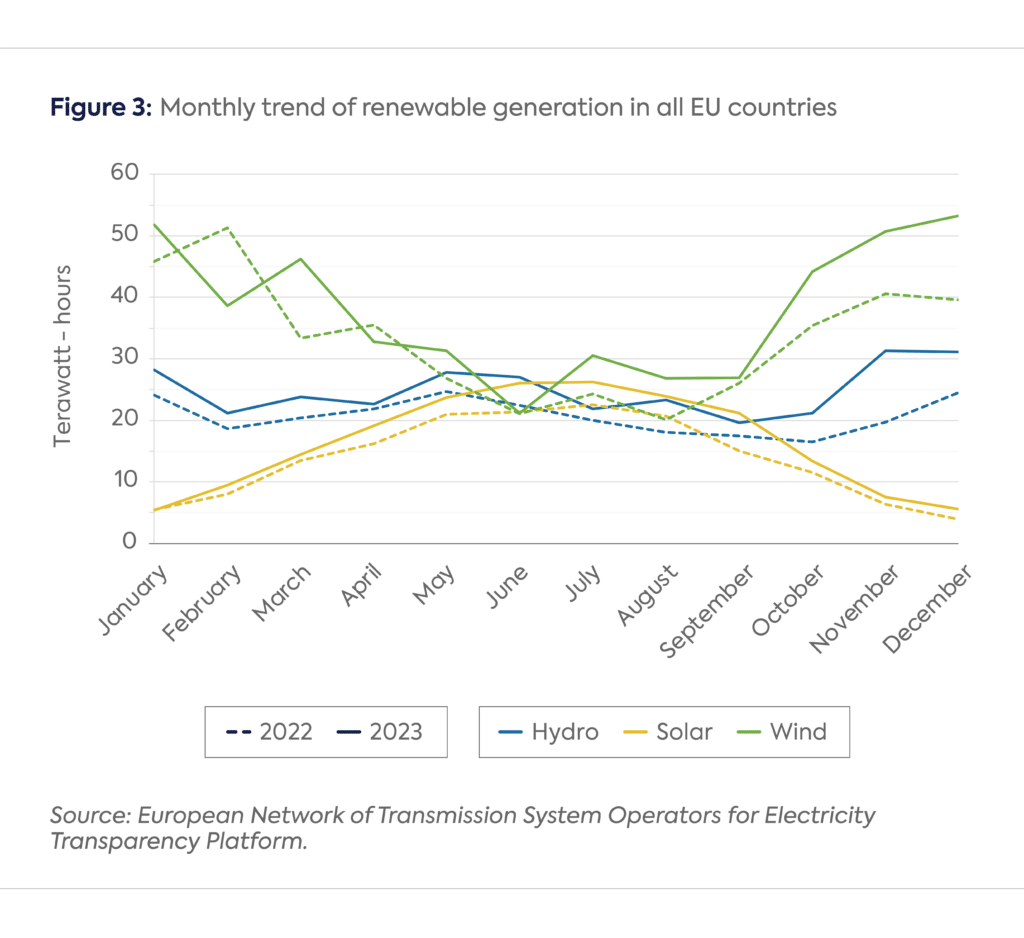
According to the International Energy Agency,[10] the EU added between 16.2 and 17.1 GW of wind capacity, notably in Northern Europe: 3.2 GW in Germany, 2.7 GW in the Netherlands, 2.5 GW in Sweden, and 1.5 GW in Poland. The increase in wind generation was particularly strong during the second half of 2023 (Figure 3). Wind generation in many European countries peaked to record levels in December 2023, reaching 53.2 TWh, up 34.3 percent year-on-year. Strong wind conditions even resulted in an increase in negative hourly power pricing.
The combination of the drop in total generation alongside an increase in renewables, nuclear, and hydro resulted in a significant decline in fossil fuel generation: 120 TWh for coal and 71.8 TWh for gas. This is roughly equivalent to a 13 billion cubic meter (bcm) drop in EU gas demand, which contributed to improving the overall EU supply-demand balance and stabilizing European gas prices in 2023. This significant drop in coal generation marks a reversal of the rebound that started in 2021 (+68.7 TWh) and extended in 2022 (+24.5 TWh), bringing coal-fired generation levels to below those in 2020.
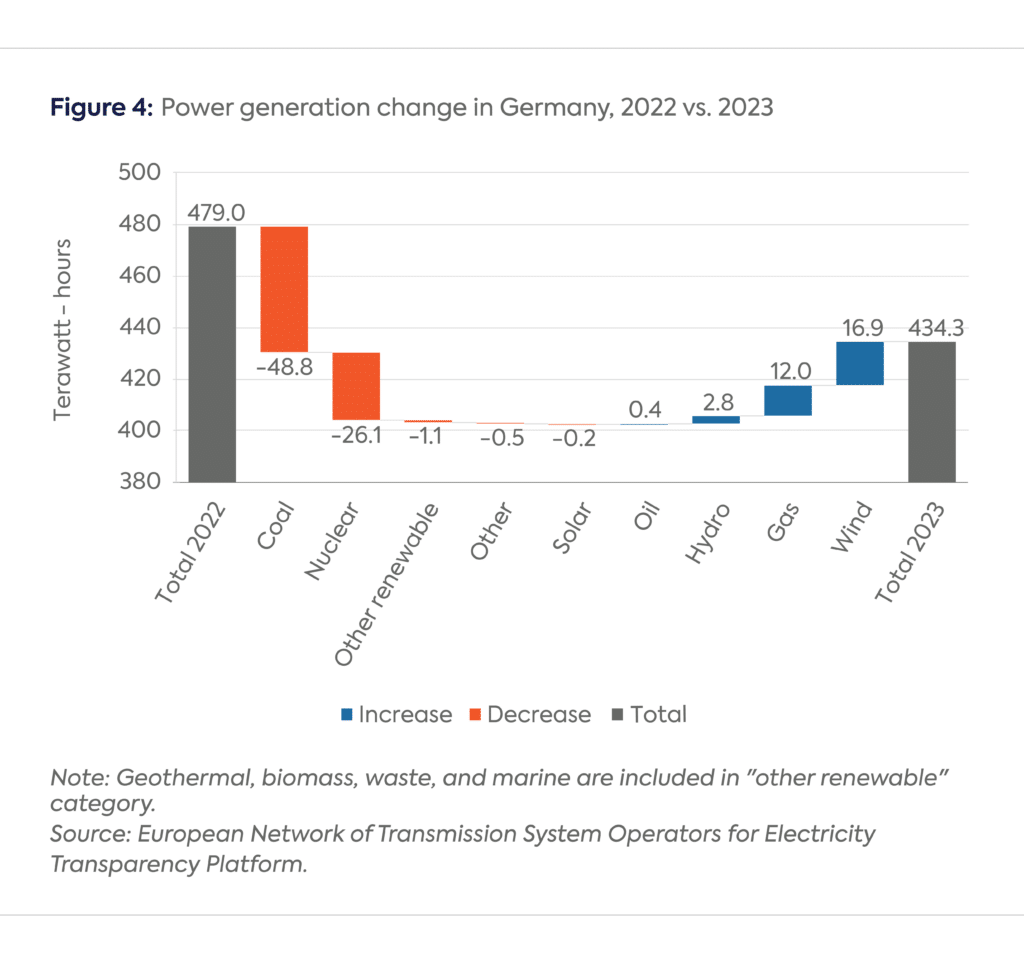
Not only has Germany lost a significant amount of generation due to reduced power consumption and increased imports (Germany has become a net power importer for the first time since 2002[11]), but it is also one of the few EU countries that has also experienced a net increase in gas-fired generation (Figure 4). As of April 16, 2023, there is no more nuclear generation in Germany for the first time since 1960. Despite the significant drop in coal-fired generation, contributing to 40 percent of the EU drop, Germany remains the largest country in terms of coal-fired generation, slightly ahead of Poland. The absence of an increase in solar generation despite the significant increase in capacity may be partially explained by the fact that around half of the capacity increase happened at the residential level.[12]
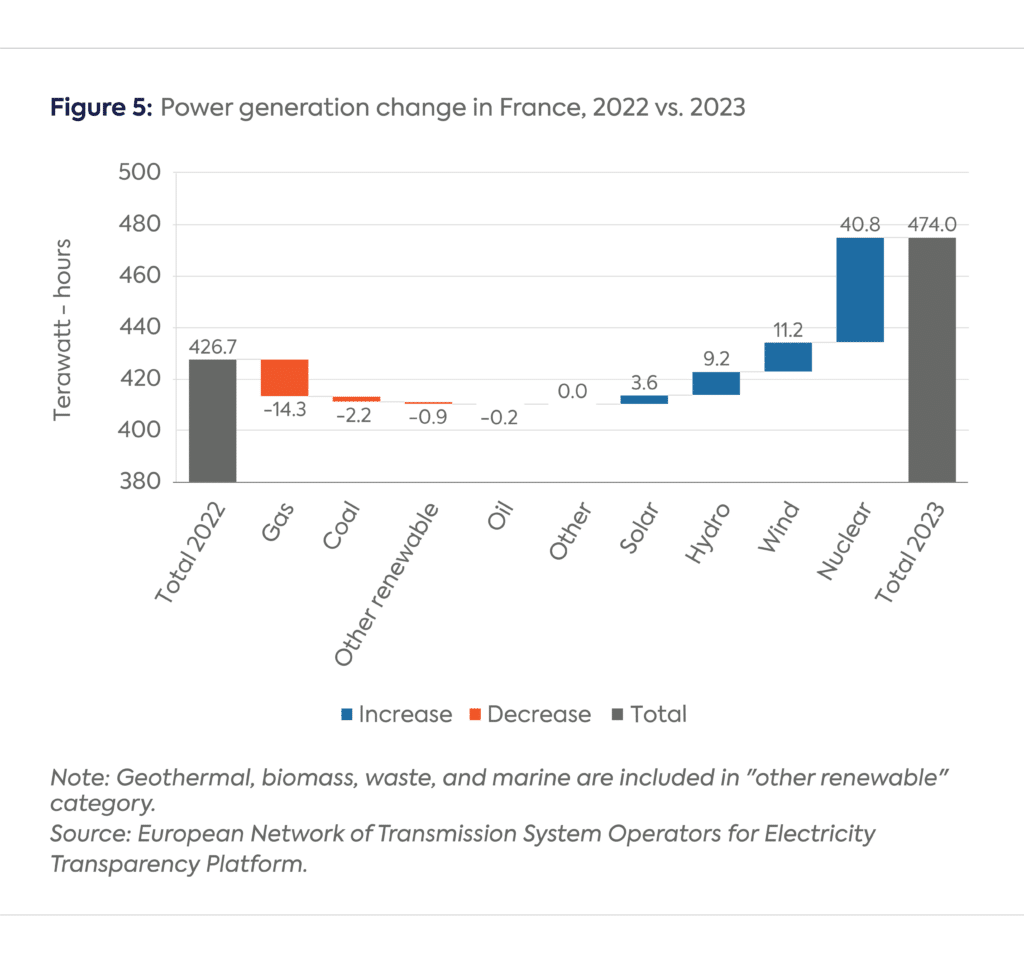
In contrast to Germany, French total generation recovered significantly from the disastrous situation in 2022. While nuclear generation is about 40 TWh higher than 2022’s record low levels, it still remains lower than pre-2020 levels (Figure 5). EDF expects a continuous improvement of nuclear generation over the coming years, notably due to the Flamanville plant coming online mid-2024. As of January 2024, France had 47 nuclear power plants representing 50 GW available. The increase in all clean power sources by around 65 TWh led to an increase in power exports as well as a reduction in gas-fired and coal-fired generation.
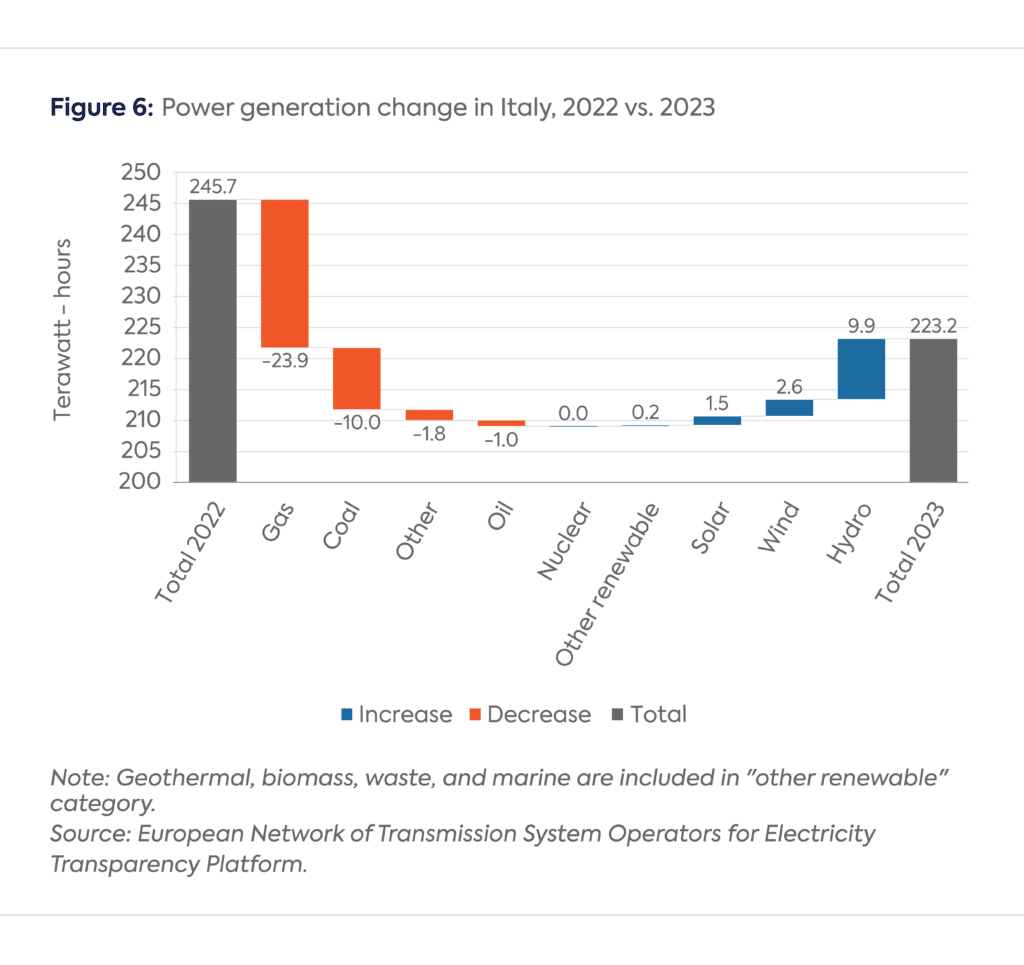
Italy’s reduction in power generation seems to originate from lower domestic demand as well as from higher power imports, notably from France.[13] The quite significant drop in gas-fired generation (-23.9 TWh) is consistent with gas transmission company Snam reporting a 3.5 bcm drop in gas demand from the power sector over the first 9 months of 2023.[14] Meanwhile, coal-fired generation dropped after the 2022 surge (Figure 6); the government began restricting its use to a minimum as emergency measures implemented during the 2022 energy crisis were scaled back in 2023.[15] Italy plans to decommission coal-fired plants by 2025 (except in Sardinia).
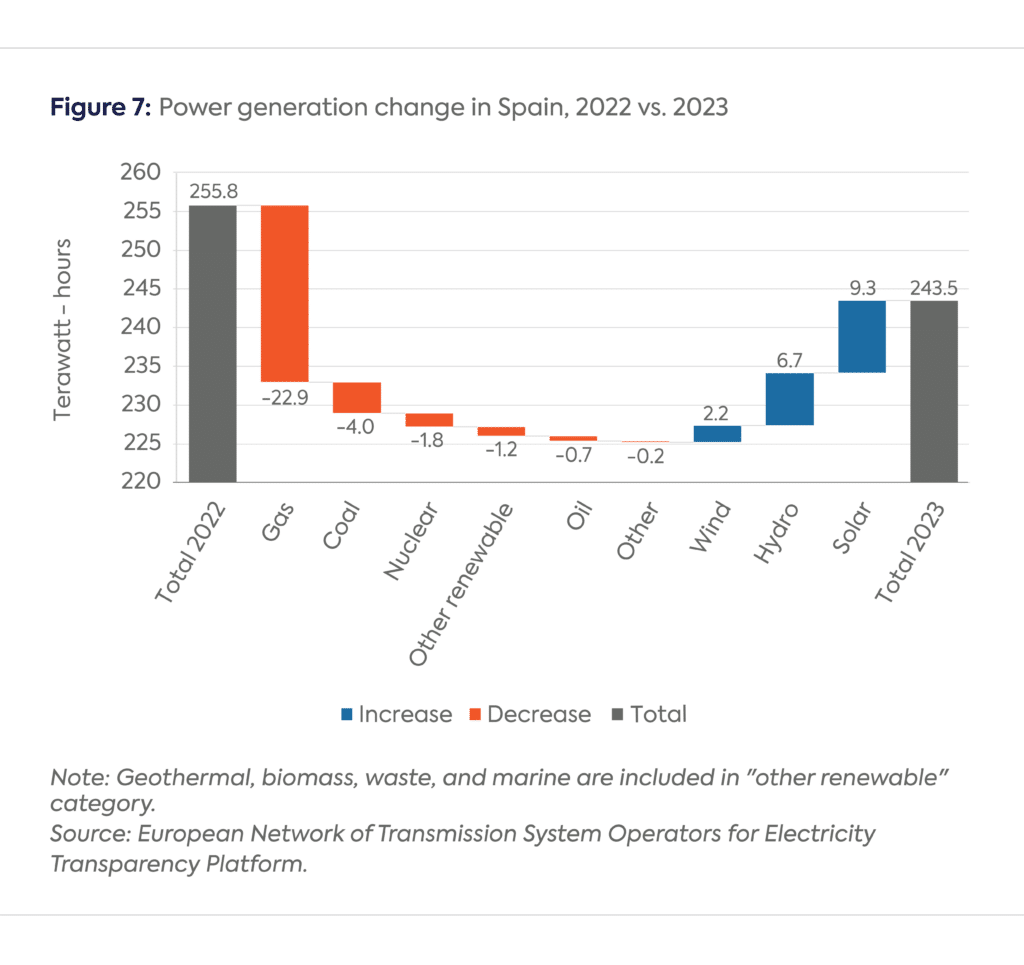
Spain also witnessed a strong increase in clean power sources—with the exception of nuclear—and a substantial drop in gas-fired generation (Figure 7), consistent with the 42 TWh of gas demand drop reported by gas transmission company Enagás.[16]
CGEP’s Visionary Circle
Corporate Partnerships
Occidental Petroleum Corporation
Tellurian Inc
Foundations and Individual Donors
Anonymous
Anonymous
the bedari collective
Jay Bernstein
Breakthrough Energy LLC
Children’s Investment Fund Foundation (CIFF)
Arjun Murti
Ray Rothrock
Kimberly and Scott Sheffield
[1] The source for all data cited in this article is the European Network of Transmission System Operators (ENTSO-E). These generation statistics can differ from other sources of electricity generation statistics, such as the International Energy Agency’s (IEA) Monthly Electricity Statistics, for the following reasons: ENTSO-E covers only the transmission-level data while the IEA also includes auto-producer plants, and ENTSO-E data comes from transmission system operators while IEA data comes from national statistical agencies. Malta and Cyprus are not included due to data limitation in ENTSO-E.
[2] Matt Ewen and Sarah Brown, “EU Fossil Generation Hits Record Low as Demand Falls,” Ember, August 30, 2023, https://ember-climate.org/insights/research/eu-fossil-generation-hits-record-low-as-demand-falls/.
[3] BDEW, “Die Energieversorgung 2023 – Jahresbericht des BDEW,“ December 20, 2023, https://www.bdew.de/service/publikationen/jahresbericht-energieversorgung/.
[4] RTE, “Consommation,” accessed January 11, 2024, https://analysesetdonnees.rte-france.com/consommation/synthese; Red Electrica, “Renewable Energy Breaks Records and Accounts for more than 50% of Electricity Generation in Spain in 2023,” December 19, 2023, https://www.ree.es/en/press-office/press-release/news/press-release/2023/12/Renewable-energy-breaks-records-and-accounts-for-more-than-50-per-cent-of-electricity-generation-Spain-2023.
[5] Copernicus, “European Summer 2023: A Season of Contrasting Extremes,” October 3, 2023, https://climate.copernicus.eu/european-summer-2023-season-contrasting-extremes.
[6] Nuclear Newswire, “Belgium’s Nuclear Phase-Out Policy Claims Second Victim,” February 2, 2023, https://www.ans.org/news/article-4707/belgiums-nuclear-phaseout-policy-claims-second-victim/.
[7] Elsa Bembaron, “Envolée de la Production d’Electricité Nucléaire d’EDF en France en 2023, ” Le Figaro, January 9, 2024, https://www.lefigaro.fr/societes/envolee-de-la-production-d-electricite-nucleaire-d-edf-en-france-en-2023-20240109.
[8] SolarPower Europe, “New Report: EU Solar Reaches Record Heights of 56 GW in 2023 but Warns of Clouds on the Horizon,” December 12, 2023, https://www.solarpowereurope.org/press-releases/new-report-eu-solar-reaches-record-heights-of-56-gw-in-2023-but-warns-of-clouds-on-the-horizon.
[9] SolarPower Europe, “EU Market Outlook for Solar Power 2023-2027,” accessed January 11, 2023, https://www.solarpowereurope.org/insights/outlooks/eu-market-outlook-for-solar-power-2023-2027/detail#eu-solar-markets-2023.
[10] IEA, “Renewable Energy Progress Tracker,” accessed January 11, 2024, https://www.iea.org/data-and-statistics/data-tools/renewable-energy-progress-tracker.
[11] Destatis, “Electricity Imports and Exports: Germany, Months, Countries,” accessed January 16, 2024, https://www-genesis.destatis.de/genesis//online?operation=table&code=43312-0002&bypass=true&levelindex=0&levelid=1705399688931.
[12] Solarwirtschaft, “2023 mehr als eine Million neue Solaranlagen,” January 3, 2024, https://www.solarwirtschaft.de/2024/01/03/2023-mehr-als-eine-million-neue-solaranlagen/.
[13] Argus Media, “Italian Power Imports at Eight Month High,” October 19, 2023, https://www.argusmedia.com/en/news/2500581-italian-power-imports-at-eightmonth-high.
[14] Snam, “Snam: Profit Increases in the first 9 Months of 2023,” November 9, 2023, https://www.snam.it/en/media/news-and-press-releases/comunicati-stampa/2023/Snam-profit-increases-in-first-9months-of-2023.html.
[15] “Italy to Cut Coal-Fired Power to Minimum,” Reuters, July 5, 2023, https://www.reuters.com/sustainability/climate-energy/italy-orders-reduce-minimum-coal-fired-power-plants-production-2023-07-05/.
[16] Enagás, “Statistical Bulletin, December 2023,” January 10, 2024, https://www.enagas.es/content/dam/enagas/en/files/gestion-tecnica-del-sistema/energy-data/publicaciones/boletin-estadistico-del-gas/Monthly%20Bulletin%20Dec23.pdf.
CGEP scholars reflect on some of the standout issues of the day during this year's Climate Week

Gulf Cooperation Council (GCC) countries have not only the world's lowest costs for oil and gas production but also the lowest costs for electricity generated from renewable energy sources.

This special CGEP blog series, featuring six contributions from CGEP scholars, analyzes the potential impacts of the OBBBA across a range of sectors.

The Canadian Nuclear Safety Commission (CNSC) issued a construction license last week for what would be the first commercial small modular reactor (SMR)[1] in North America.

About one in four American households experience some form of energy insecurity. Within this group, Black, Indigenous, Latine, low- and moderate-income (LMI), and other disadvantaged communities face a disproportionately higher burden.