This website uses cookies as well as similar tools and technologies to understand visitors’ experiences. By continuing to use this website, you consent to Columbia University’s usage of cookies and similar technologies, in accordance with the Columbia University Website Cookie Notice.
The Center on Global Energy Policy (CGEP) at Columbia University SIPA congratulates Paul Dabbar on his confirmation as Deputy Secretary of the United States Department of Commerce. During...
• June 27, 2025
Energy Explained
Get the latest as our experts share their insights on global energy policy.
China’s dependence on the energy supplies that move through the Strait of Hormuz makes it especially vulnerable to any possible closure of the waterway by Iran in retaliation for attacks by Israel and the United States.
Just two days after President Trump deployed America’s military to attack Iranian nuclear development sites, a shaky ceasefire between Israel and Iran brokered by President Trump emerged. So...
This year, the Third Annual Energy Opportunity Lab (EOL) Forum will take place July 7th and 8th in Washington, DC, offering a chance for the Washington policymaking community...
Event
About Us
We are the premier hub and policy institution for global energy thought leadership. Energy impacts every element of our lives, and our trusted fact-based research informs the decisions that affect all of us.
Economic. A disproportionate share of household income is allocated to utility expenses (i.e., energy burden).
Physical. Housing deficiencies and inefficiencies impact thermal comfort, induce harmful environmental exposure, and/or increase energy costs.
Coping. Households use adaptive strategies to manage and cope with the physical and economic hardships associated with EI.
Prevalence
Among all US households in 2020, 33.53 million experienced some form of EI. More specifically[2]
24.61 million reduced or went without food or medicine to pay energy costs.
12.36 million received disconnection notices.
6.03 million were unable to use an air-conditioner.[3]
12.20 million left their homes at unhealthy temperatures to avert high energy bills.
5.08 million were unable to use heating equipment.[4]
Unequal Distribution
Although EI is widespread in the US, it is not equally distributed across all populations; disparities exist by race and ethnicity, income and wealth, and housing characteristics.[5]
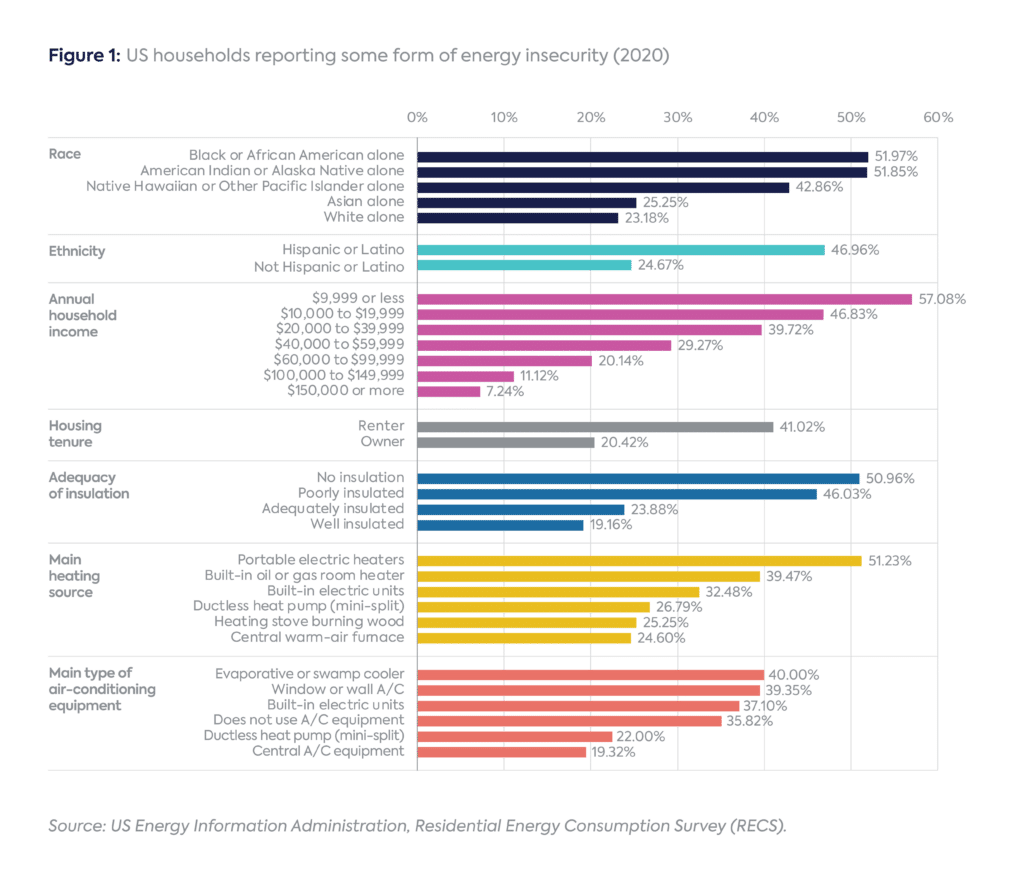
Race and ethnicity. In 2020, Black and Indigenous populations were more than twice as likely as other groups to experience EI. Compared to 23 percent of white households, 52 percent of Black and American Indian or Alaska Native households experienced some form of EI (see Figure 1). Nearly half (47 percent) of Hispanic households experienced some form of EI compared to 25 percent of non-Hispanic households.[6]
Income and wealth. More than half (51 percent) of households making less than $20,000 a year reported experiencing energy insecurity in 2020. As Figure 1 shows, this percentage decreases steadily as income increases.[7] For example, households earning less than $20,000 a year were seven times more likely to experience EI than those making $100,000 a year or greater.[8]
Housing Characteristics. Renters were twice as likely as owners to experience EI—41 versus 20 percent. Furthermore, 47 percent of households living in poorly insulated homes, 51 percent of those using portable electric heaters as a main heating source, and about 40 percent of those using inefficient cooling (i.e., swamp coolers and window A/C units) experienced some form of EI.
Policy Recommendations
Addressing EI requires improving the physical condition of housing and reducing cost burdens. Specific measures to be taken include:
Prioritize groups most impacted by EI, including low-income households and Black, Indigenous, Latino, and other People of Color, for energy efficiency and housing decarbonization benefits.
Prioritize rental properties in housing improvement initiatives.
Improve insulation and upgrade heating and cooling units with high-efficiency, dual-function options
Link eligible households to bill assistance programs such as the Low Income Home Energy Assistance Program (LIHEAP) through more aggressive outreach and engagement efforts to increase awareness among populations heavily impacted by EI, and streamline the LIHEAP application process.
Increase household income via higher living wages and cross-enrollment in safety net programs such as rental assistance, Supplemental Nutrition Assistance Program, and Medicaid.
Design tiered utility rate structures for low-income groups such as percent of income payment plans.
[2] US Energy Information Administration (EIA), “2020 Residential Energy Consumption Survey,” accessed October 14, 2022, https://www.eia.gov/consumption/residential/data/2020/.
[3] Includes inability to use air-conditioning equipment at any time during the previous 12 months because equipment was broken and household could not have it repaired or because of an electricity disruption due to lack of payment.
[4] Includes inability to use main heating equipment at any time during the previous 12 months because equipment was broken and household could not have it repaired or because of an electricity, natural gas, or bulk fuel disruption due to lack of payment.
[5] EIA, “2020 Residential Energy Consumption Survey.”
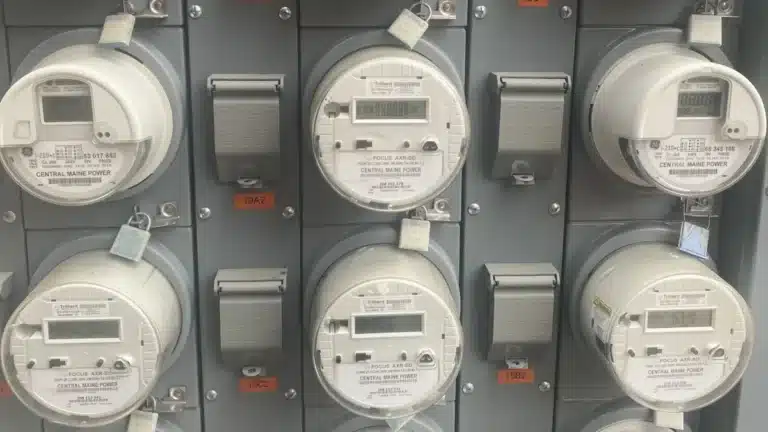
Even as the U.S. pursues an energy agenda centered on achieving affordability through abundance, utilities and local governments have tools to help families navigate energy insecurities.
The Just Energy Transition Partnership (JETP) framework[1] was designed to help accelerate the energy transition in emerging market and developing economies (EMDEs) while embedding socioeconomic[2] considerations into its planning and implementation.
Commentary
by Gautam Jain & Ganis Bustami• March 03, 2025
Almost 34 million American households were considered energy insecure in 2020, with the majority foregoing food or life-saving medicine at least once in order to pay their utility bills.