Trump is frustrated gasoline prices don’t mirror oil’s decline. Experts say it’s not that simple
U.S. gasoline prices decreased an average of 49 cents a gallon in the last month as expectations rose for an end to the war with Iran.
Get the latest as our experts share their insights on global energy policy.
This Energy Explained post represents the research and views of the author(s). It does not necessarily represent the views of the Center on Global Energy Policy. The piece...
Hear in-depth conversations with the world’s top energy and climate leaders from government, business, academia, and civil society.
The energy transition is in the midst of its own transition. Spiking electricity demand and geopolitical events are driving up energy prices, while debates over the best sources...

Commentary by Qëndresa Krasniqi, Vivek Shastry, Alexandra Peek + 1 more • July 01, 2024
This commentary represents the research and views of the author. It does not necessarily represent the views of the Center on Global Energy Policy. The piece may be subject to further revision. Contributions to SIPA for the benefit of CGEP are general use gifts, which gives the Center discretion in how it allocates these funds. More information is available at Our Partners. Rare cases of sponsored projects are clearly indicated.
Millions of US households struggle to meet their energy needs due to low wages, rising living costs,[i] and other historical and structural drivers of poverty. Over 30 million US households (more than one-quarter) faced energy insecurity in 2020, the latest date such data was compiled by the US Energy Information Administration (EIA).[ii] Low-income, Black, American Indian, and Hispanic households experience the most substantial challenges in meeting their energy needs.[iii] Much of the evidence to date about the factors contributing to this experience has emphasized household income, energy consumption patterns, and housing conditions,[iv] yet utility policies and practices also play a key role in exacerbating energy disparities—and rectifying them.
Energy insecurity, defined as the inability to adequately meet household energy needs, manifests in chronic and acute forms, reflecting ongoing hardships and episodic lapses in access.[v] Despite the occasional influx of emergency funds from the federal government and other assistance programs by state governments and utilities, these programs do not serve many eligible families who are in economic distress but unaware of the existence of the programs. For some low-income households, barriers to applications for participating in such programs include administrative burdens, the lack of an internet connection, a lengthy and complicated application, and/or language barriers.[vi] Therefore, while allocating sufficient government funds to relieve utility debt for millions of households is important, fundamental changes such as ensuring equitable rates and more inclusive and transparent decision-making processes that govern utility practices are key to preventing different forms of chronic energy insecurity, including utility debt and disconnections.
The prices households are charged for utility services define the extent of the energy burden (percent of household income spent on energy costs) they face and their ability to meet their energy needs. As such, the structure of utility rates and availability of rate discounts play a crucial role in alleviating household energy insecurity. Similarly, the extent of energy insecurity can be affected by policies dictating household utility debt management and forgiveness, disconnection practices and power outage management and resilience investments. Public utility commissions (PUCs) hold significant authority over these policies and practices, effectively determining the extent of equitable access to affordable and reliable electricity. This highlights the critical role they play in reducing energy insecurity.
This commentary highlights some key courses of action identified in research on alleviating energy insecurity, including 1) rate designs that are fair, reasonable, and non-discriminatory, that provide relief for those most burdened by high energy costs, 2) state and federal mandates for utilities to report debt, disconnections, and outage data, with details on household race and ethnicity, age, income, and medical vulnerabilities, 3) elimination of power shutoffs for non-payment for low-income households, and 4) prioritization of disinvested neighborhoods for infrastructure modernization and maintenance and for power restoration during outages.
In most states and utility markets in the US, customers pay equal rates, even as they face unequal burdens. More specifically, most utilities charge the same rates to all residential customers regardless of household income, energy burden levels, relevant competing costs, or other forms of disadvantage. Such rates have a regressive effect and pose an unequal burden, particularly on low-income customers.[vii]
According to the EIA, as of March 2024 the average US electricity rate for residential customers is 16.68 cents per kilowatt-hour (kWh), which is higher than industrial, commercial, and transportation sectors, with rates of 7.7, 12.76, and 11.91 cents per kWh, respectively.[viii] These rates vary substantially by region and state. California, for instance, has the second highest residential electricity rate (at 32.47 cents per kWh, following Hawaii’s 45.25), but it also has one of the most robust rate affordability schemes for low- and moderate-income customers in the country.
Additionally, some power utilities are increasing fixed charges—fees assessed on monthly bills to access utility services— to recover the costs of maintaining the grid, which is becoming more necessary (and challenging) in the face of climate threats.[ix] Such rates have a regressive effect on low-income customers, who have been shown to consume less energy through vigilant conservation.[x] The EIA recently reported that energy insecure households pay $0.20 more annually per square foot (for heating, cooling, and powering appliances) than the national average and $0.26 more than non-energy-insecure households, due to factors such as poor housing quality and reliance on less efficient energy sources.[xi]
Innovations in utility rate designs have the potential to address inequities in energy affordability. Evolving models that differ from traditional utility rate structures include: 1) inclining block rates, which impose higher rates on higher levels of usage,[xii] 2) time-of-use rates, with peak-time rebates that reward customers for reducing consumption during high-cost periods,[xiii] 3) fixed or tiered low-income bill discounts,[xiv] and 4) percentage of income payment plans.[xv]In addition to the rate design itself, equity considerations are being introduced through the ratemaking process via financial incentives for intervenors and increased public participation.[xvi]
Tools available to state and local governments, PUCs, and utilities toward more equitable rates include the following:
STATE SPOTLIGHT: Billing Adjustments
The California Alternate Rates for Energy Program (CARE) provides low-income customers a 30–35 percent discount on their electric bill and a 20 percent discount on their natural gas bill.
California’s Family Electric Rate Assistance Program (FERA) provides an 18 percent discount on the electricity bill of families whose household income slightly exceeds the CARE allowances.
The New York State Energy Affordability Program provides income-eligible customers with bill credits on their electric and/or gas bills, with the goal of limiting the energy burden of low-income customers to 6 percent or below of their income.
According to the National Energy Assistance Directors’ Association, more than one in six US households, 16 percent of all US households (21.2 million), are behind on their energy bills.[xvii] The national arrearage balance increased to $20.3 billion in December 2023 (from $17.7 billion in January 2023). According to the EIA, the nominal residential rate of electricity has almost doubled in the last 20 years, from 8.72 cents per kWh in 2003 to 15.98 cents per kWh in 2023, with an average annual increase of 3.08% since 2003 (a 0.5% annual increase when adjusted for inflation).[xviii] The average monthly electricity bill for residential customers, after adjusting for inflation, increased by 5% from 2021 to 2022, the largest increase in 40 years, resulting in the largest annual increase in average electricity spending since the EIA began calculating it in 1984.[xix]
Black, American Indian, and Hispanic households struggle disproportionately to pay for their energy bills. An American Council for an Energy-Efficient Economy study found that the median energy burden for Black and Native American households is about 43 percent higher than for non-Hispanic White households (approximately 4.2 and 4.3 percent, respectively, versus 2.9 percent), and the median energy burden for Hispanic households is about 20 percent higher than for non-Hispanic White households (approximately 3.5 percent).[xx] Separately, a recent UCLA study found that predominantly Latinx neighborhoods carry the highest burden in terms of utility debt, with Hispanic communities representing an estimated 64 percent of all neighborhoods in the highest category of energy debt.[xxi]
In 2023, Congress allocated $6.1 billion to the Low-Income Home Energy Assistance Program (LIHEAP) to help low-income families pay their energy bills.[xxii] Previously, in an effort to help families with energy burdens exacerbated by the Covid-19 pandemic, the Treasury Department’s Emergency Rental Assistance program was allocated $45.25 billion in stimulus funds.[xxiii] Additionally, some states have added interventions such as debt forgiveness programs, which provide much needed relief to households facing energy insecurity, though many of these protections are fleeting.[xxiv]
Examples of tools available to PUCs and utilities to help alleviate utility debt include the following:
STATE SPOTLIGHT: Debt Forgiveness
New York State announced a statewide debt forgiveness program in 2023 that provided a one-time credit on customers’ accounts for unpaid Covid-19-period balances accrued through May 1, 2022.
Utility debt can lead to disconnections, an acute form of energy insecurity. Disconnections have been linked to house fires, hypothermia-related deaths, and the intensification of chronic illness.[xxv] Furthermore, the threat of disconnection harms the health and well-being of those affected before they even receive a disconnection notice. The most common response to the threat is giving up basic necessities,[xxvi] such as “going hungry, managing without medication, and enduring hotter or colder household temperatures than are comfortable or healthy.”[xxvii]
Utility shutoffs due to nonpayment are a longstanding problem, exacerbated by the pandemic. The full scope of the impact of disconnections remains undocumented, as disconnection data is not made publicly available in all states. Utilities report shutoff data in 33 states and the District of Columbia,[xxviii] and there has been little analysis of these numbers. According to one review of this data submitted to utility regulatory commissions, in the 33 states and DC, disconnections increased by 79% between 2020 and 2021, and more than 3.6 million households were disconnected during the first two years of the Covid-19 pandemic (January 2020–December 2021).[xxix]
Similarly, though outside the emergency context of a pandemic, more than 17 million households received a disconnection notice and over 3 million experienced a disconnection in 2015 (the latest date such data was compiled by the EIA before the pandemic), nearly 15 percent and 3 percent of US households, respectively.[xxx] Utility disconnections disproportionately affect non-White households: 39 percent of Native American households and 29 percent of Black households received a disconnection notice in 2015, compared to 13 percent of White households. The share of households with actual disconnections in 2015 was also higher among Black households (6.5 percent compared to 2.2 percent of White households) and households earning less than $20,000 (7.9 percent).[xxxi] The disparities persisted in 2020.[xxxii]
The National Association for the Advancement of Colored People (NAACP) has called for the establishment of a universal right to uninterrupted energy service, based on the concept of energy as a basic human right.[xxxiii] Accordingly, the NAACP has called for utility companies to incorporate a list of foundational principles into their models and policies, such as ensuring inclusion of customers in the development of utility policies and regulations, and creating full transparency of the information and actions of utilities, regulatory bodies, legislatures, and utility-affiliated organizations, among others, with an end goal of prioritizing utility policies that place a moratorium on utility disconnections.[xxxiv] The organization has further proposed detailed procedural and seasonal protections, including: 1) creating temperature- and date-based disconnection protections, 2) setting disconnection arrearage minimums, 3) establishing simple procedures for socially and medically vulnerable groups to apply for protection from disconnections, and 4) implementing customer surveys to screen for socially vulnerable individuals and ensuring active outreach to socially vulnerable customers for inclusion in protection programs, etc.
Tools available to PUCs and utilities to prevent the damaging effects of utility disconnections include the following:
STATE SPOTLIGHT: Ceasing Shutoffs, and Inclusive Utility Regulation
The Los Angeles Department of Water and Power abolished water and power shutoffs for low-income customers in 2022 to alleviate these severe forms of energy insecurity.
California’s state legislature established the Low Income Oversight Board in 2005 to advise the California Public Utility Commission (CPUC) on low-income electric and gas customers’ issues and to serve as a liaison between the CPUC and low-income ratepayers and their representatives. The board has played a key role in securing protections for low-income customers, including utility disconnection caps, protections for LIHEAP recipients and other low-income customers, extreme weather disconnection protections, and debt forgiveness for CARE/FERA customers.[xxxv]
The number of weather-induced major power outages (affecting more than 50,000 customers) has increased by 78 percent in the last decade.[xxxvi] These outages are predicted to keep increasing in number as hurricanes, wildfires, ice storms, flooding, and heat waves grow in frequency and duration.[xxxvii]
Studies have identified significant health impacts of power outages, including mortality to all cause; carbon monoxide poisoning; temperature-related illness; gastrointestinal illness; and hospitalization related to cardiovascular, respiratory, and renal disease, especially among those who rely on electrically powered medical devices.[xxxviii]
The experience, burden, and impact of these outages are not equal across all populations. Racial and ethnic disparities have also been documented in the frequency, duration, and impact of power outages when grid infrastructure fails during severe weather or other climate-fueled disasters.
A study by researchers at Columbia University and Stanford University analyzing the distribution of power outages in Texas during Winter Storm Uri of February 2021 showed that people self-reporting as Black or African American were associated with 1.7 times higher odds of experiencing an outage for at least 24 consecutive hours than those self-reporting as White or Caucasian.[xxxix] Similarly, a Rockefeller Foundation study analyzing the impact of the same storm found that areas in the state with a high share of “minority” population were more than four times as likely to suffer a blackout than predominantly White areas.[xl] More specifically, the study found that about 10–11 percent of the population in predominantly White areas suffered a blackout compared to 47 percent in high-minority-share areas.
The Rockefeller study found that the role of income status of the area, or its proximity to “critical infrastructure,” was not significant enough to explain the disparity among neighborhoods, instead showing that the share of minorities was more strongly associated with a blackout (see Figure 1).
Figure 1. Share of the population in least-minority, medium-minority, and high-minority areas experiencing the February 2021 Texas blackouts by income level
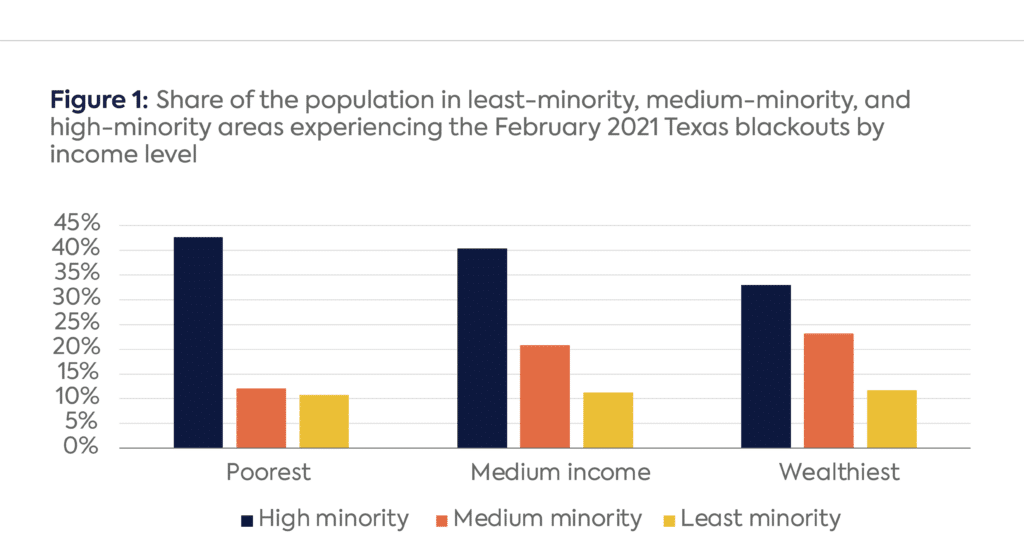
Source: F. C. Hsu, J. Taneja, J. Carvallo, and Z. Shah, “Frozen Out in Texas: Blackouts and Inequity,” The Rockefeller Foundation, April 14, 2021, https://www.rockefellerfoundation.org/insights/grantee-impact-story/frozen-out-in-texas-blackouts-and-inequity/.
Previous studies have found a significant correlation between the duration of power outages and whether the areas are minority-dominated/non-White.During Hurricane Irma in 2017, Florida counties with a high Hispanic or Latino population experienced longer outages than White-dominated counties.[xli] Another study found higher average duration of outages between 2002 and 2004 in American Indian communities than in all others.[xlii]
In addition to experiencing more frequent and longer outages, low-income households of color are often less prepared and less likely to be able to evacuate during disasters and prolonged outages.[xliii]An analysis of mobility patterns during and after Hurricane Harvey in the Greater Houston Area found that race was a significant predictor of people’s ability to evacuate: Black and Hispanic households, including those in “non-poor” neighborhoods, were less likely to evacuate than their White counterparts.[xliv]
One community-based initiative, We the People Michigan, identified disinvested grid infrastructure in Southeast Michigan being a key driver of inequities in power outages[xlv] and has documented discriminatory patterns in grid modernization investments.[xlvi] More specifically, their analysis found that infrastructure hardening (which can include a wide range of activities from upgrading wires to trimming trees) schedules favor wealthier neighborhoods, while efforts for complete modernization of the grid favor industrial and municipal customers over residents. The study found that the lowest priority areas for hardening have the highest rates of poverty and unemployment.[xlvii] The initiative has, as a result, called for transparency on the types of infrastructure hardening that take place in disinvested neighborhoods as well as prioritization of these neighborhoods for grid modernization.[xlviii]
Another step toward reducing disparities in power outage impact includes establishing community-based criteria for prioritizing restoration efforts, such as health and economic vulnerabilities, population density, and neighborhoods with high historical outage trends.[xlix] Research has suggested that a key step in addressing disparities in power outages is prioritizing historically neglected neighborhoods in power restoration efforts once outages occur.[l]
Tools available to PUCs and utilities to help address disparities in power outages include the following:
STATE SPOTLIGHT: Infrastructure Planning
While there have been no documented instituted policies and practices within utilities to prioritize marginalized neighborhoods in infrastructure hardening and modernization, the California Public Utility Commission in 2022 issued a report requiring investor-owned utilities to “overlay planned infrastructure mitigations on the CalEnviroScreen map to identify what portions of the mitigations would occur within disadvantaged communities, when geographic locations of proposed mitigations are known.”
This commentary describes the axes of energy affordability and energy access as points of entry to understand how utility practices can be modified through pragmatic policy measures to address both chronic and acute forms of energy insecurity. Chronic energy insecurity often develops because of unaffordable energy bills that mount into utility debt, and can be exacerbated by episodes of acute energy insecurity in the form of disconnections due to non-payment and power outages. These manifestations of energy insecurity are interconnected and often act synergistically; therefore, utility practices and policies that aim to reduce energy insecurity should examine their intersections and coordinate efforts to address them holistically to upend vicious cycles of hardship and inequality.
[i] The average inflation rate in 2022, for example, was around 6.5 percent, with peak monthly inflation reaching 9.1 percent, marking the largest increase in 40 years. Rising energy costs were a major factor, with the average retail electricity price increasing by 11 percent. See: US Bureau of Labor Statistics, “Consumer Price Index: 2022 in review,” The Economics Daily, January 17, 2023, https://www.bls.gov/opub/ted/2023/consumer-price-index-2022-in-review.htm#:~:text=Consumer%20prices%20for%20all%20items,for%20food%20away%20from%20home; US Bureau of Labor Statistics, “Consumer prices up 9.1 percent over the year ended June 2022, largest increase in 40 years,” The Economics Daily, July 18, 2022, https://www.bls.gov/opub/ted/2022/consumer-prices-up-9-1-percent-over-the-year-ended-june-2022-largest-increase-in-40-years.htm; US Energy Information Administration, “U.S. residential electricity bills increased 5% in 2022, after adjusting for inflation,” Today in Energy, May 31, 2023,https://www.eia.gov/todayinenergy/detail.php?id=56660#:~:text=In%202022%2C%20the%20average%20U.S.,prices%20went%20up%20by%202.5%25.
[ii] US Energy Information Administration, “In 2020, 27% of U.S. Households Had Difficulty Meeting Their Energy Needs.” Today in Energy, April 11, 2022, https://www.eia.gov/todayinenergy/detail.php?id=51979.
[iii] D. Hernández, Q. Krasniqi, and A. Peek, “Fact Sheet: Energy Insecurity in the United States,” Center on Global Energy Policy, Columbia University, October 2023, https://www.energypolicy.columbia.edu/wp-content/uploads/2023/08/Energy-insecurity-fact-sheet-FINAL-adjusted-10.19.23.pdf.
[iv] Diana Hernández, “Understanding ‘energy insecurity’ and why it matters to health,” Social Science & Medicine 167 (2016): 1–10, https://doi.org/10.1016/j.socscimed.2016.08.029.
[v] Ibid.
[vi] S. R. González, P. M. Ong, G. Pierce, and A. Hernandez, “Keeping the Lights and Water On: Covid-19 And Utility Debt in Los Angeles’ Communities of Color,” University of California, Los Angeles, May 2021, https://innovation.luskin.ucla.edu/wp-content/uploads/2021/04/Keeping-the-Lights-and-Water-On.pdf.
[vii] S. Borenstein, M. Fowlie, and J. Sallee,“ Paying for Electricity in California: How Residential Rate Design Impacts Equity and Electrification,” Next10, https://www.next10.org/sites/default/files/2022-09/Next10-paying-for-electricity-final-comp.pdf.
[viii] US Energy Information Administration, “Electric Power Monthly,” accessed June 10, 2024, https://www.eia.gov/electricity/monthly/epm_table_grapher.php?t=epmt_5_6_a.
[ix] Melissa R. Allen-Dumas et al., “Extreme Weather and Climate Vulnerabilities of the Electric Grid,” Oak Ridge National Laboratory, August 16, 2019, https://www.energy.gov/oe/articles/oak-ridge-national-laboratory-response-grid-rfi.
[x] M. Simes, T. Rahman, and D. Hernández, “Vigilant conservation: How energy insecure households navigate cumulative and administrative burdens,” Energy Research & Social Science 101(July 2023), https://doi.org/10.1016/j.erss.2023.103092.
[xi] US Energy Information Administration, “US energy insecure households were billed more for energy than other households,” Today in Energy, May 30,2023, https://www.eia.gov/todayinenergy/detail.php?id=56640.
[xii] J. Lazar, “Implementing the Three Principles of Smart Rate Design,” American Public Power Association, August 22, 2019, https://www.publicpower.org/blog/implementing-three-principles-smart-rate-design.
[xiii] Power System Engineering, Inc. “Peak Time Rebate Programs: Reducing Costs While Engaging Customers,” 2016, https://www.powersystem.org/wp-content/uploads/2018/04/Peak-Time-Rebate-Programs-Reducing-Costs-While-Engaging-Customers.pdf.
[xiv] LeBel, M. (2021). LMI Affordability Through Rate Design. Retrieved May 17, 2024, from chrome-extension://efaidnbmnnnibpcajpcglclefindmkaj/ https://www.meeaconference.org/sites/meeaconference.org/files/media/lmi-affordability-through-rate-design-final-widescreen.pdf.
[xv] A. Nishi, D. Hernández, and M. Gerard, “Energy Insecurity Mitigation: The Low Income Home Energy Assistance Program and Other Low-Income Relief Programs in the US,” Center on Global Energy Policy, Columbia University, Nov. 15, 2023, https://www.energypolicy.columbia.edu/publications/energy-insecurity-mitigation-the-low-income-home-energy-assistance-program-and-other-low-income-relief-programs-in-the-us/.
[xvi] R. Nagra, J. Bergman, and J. Graham, “Regulatory Theater: How Investor-Owned Utilities and Captured Oversight Agencies Perpetuate Environmental Racism,” City University of New York Law Review 25, no. 2 (Summer 2022), https://academicworks.cuny.edu/cgi/viewcontent.cgi?article=1548&context=clr.
[xvii] The National Energy Assistance Directors Association, “States Call for Congress to Restore Funding for LIHEAP: About 1.4 Million Households Could be Cut from the Program” press release, January 23, 2024, https://neada.org/wp-content/uploads/2024/01/pr-recordhhbehind.pdf.
[xviii] US Energy Information Administration, “Electricity data browser – Average retail price of electricity,” accessed February 15, 2024, https://www.eia.gov/electricity/data/browser/#/topic/7?agg=2,0,1&geo=g&freq=M.
[xix] US Energy Information Administration, “U.S. residential electricity bills increased 5% in 2022, after adjusting for inflation,” Today in Energy, May 31, 2023, https://www.eia.gov/todayinenergy/detail.php?id=56660.
[xx] A. Drehobl, L. Ross, and R. Ayala, “An Assessment of National and Metropolitan Energy Burden across the United States,” ACEEE (September 2020), https://www.aceee.org/sites/default/files/pdfs/u2006.pdf.
[xxi] González, S. R., Ong, P. M., Pierce, G., and Hernandez, A. (2021). “Keeping the Lights and Water On: Covid-19 and Utility Debt in Los Angeles’ Communities of Color,” University of California, Los Angeles, May 2021, https://innovation.luskin.ucla.edu/wp-content/uploads/2021/04/Keeping-the-Lights-and-Water-On.pdf.
[xxii] A. Nishi, D. Hernández, and M. Gerard, “Energy Insecurity Mitigation: The Low Income Home Energy Assistance Program and Other Low-Income Relief Programs in the US,” Center on Global Energy Policy, Columbia University, Nov. 15, 2023, https://www.energypolicy.columbia.edu/publications/energy-insecurity-mitigation-the-low-income-home-energy-assistance-program-and-other-low-income-relief-programs-in-the-us/.
[xxiii] The National Energy Assistance Directors Association, “LIHEAP and Utility Assistance Funding Status: Regular & Pandemic-Related Funding,” March 15, 2021, https://neada.org/wp-content/uploads/2021/03/pandemicutilityassistance.pdf.
[xxiv] D. J. Bednar and T. G. Reames, “Fleeting energy protections: state and utility level policy responses to energy poverty in the United States during COVID-19,” Energy Research & Social Science 99 (May 2023): 103045, https://www.sciencedirect.com/science/article/pii/S2214629623001056?via%3Dihub.
[xxv] Markus Franklin and Caroline Kurtz, “Lights Out In The Cold: Reforming Utility Shut-Off Policies as if Human Rights Matter,” NAACP, March 2017, https://naacp.org/resources/lights-out-cold.
[xxvi] Hernandez and Laird, “Surviving a Shut-Off: U.S. Households at Greatest Risk of Utility Disconnections and How They Cope,” American Behavioral Scientist 66, no. 7 (May 2021), https://www.researchgate.net/publication/351440651_Surviving_a_Shut-Off_US_Households_at_Greatest_Risk_of_Utility_Disconnections_and_How_They_Cope.
[xxvii] Ibid.
[xxviii] Jean Su and Christopher Kuveke, “Powerless in the Pandemic 2.0: Electric Utilities Are Still Choosing Profits Over People,” Center for Biological Diversity, BailoutWatch, and Tiger Moth, April 2022, https://bailout.cdn.prismic.io/bailout/ddebd6e2-b136-4dc8-a1da-f6d4583b4c24_Powerless_Report2022_final.pdf.
[xxix] Ibid.
[xxx] Hernandez and Laird, “Surviving a Shut-Off: U.S. Households at Greatest Risk of Utility Disconnections and How They Cope,” American Behavioral Scientist 66, no. 7 (May 2021), https://www.researchgate.net/publication/351440651_Surviving_a_Shut-Off_US_Households_at_Greatest_Risk_of_Utility_Disconnections_and_How_They_Cope.
[xxxi] Ibid.
[xxxii] US Energy Information Administration, “Independent Statistics and Analysis,” accessed October 14, 2022, https://www.eia.gov/consumption/residential/data/2020/
[xxxiii] D. Hernández, “Sacrifice Along the Energy Continuum: A Call for Energy Justice,” Environ Justice 8, no. 4 (Aug. 18, 2015): 151–156, https://pubmed.ncbi.nlm.nih.gov/27053980/.
[xxxiv] Markus Franklin and Caroline Kurtz, “Lights Out In The Cold: Reforming Utility Shut-Off Policies as if Human Rights Matter,” NAACP, March 2017, https://naacp.org/resources/lights-out-cold.
[xxxv] Justin Fong, “Low-Income Oversight Board Disconnections R.18-07-005 Update” presentation, California Public Utilities Commission, 2020, liob.cpuc.ca.gov/wp-content/uploads/sites/14/2020/12/Item-007-CPUC-Disconnections-Update-LIOB201210.pdf.
[xxxvi] Climate Central, “Surging Weather-related Power Outages,” Sept. 14, 2022, https://www.climatecentral.org/climate-matters/surging-weather-related-power-outages.
[xxxvii] Ibid.
[xxxviii] J. Casey et al., “Power Outages and Community Health: a Narrative Review,” Current Environmental Health Reports 7 (2020): 371–383, https://doi.org/10.1007/s40572-020-00295-0.
[xxxix] N. Flores, N. M., McBrien, H., Do, V., Kiang, M. V., Schlegelmilch, J., and Casey, J. A. (2023). The 2021 Texas Power Crisis: distribution, duration, and disparities. Journal of Exposure Science & Environmental Epidemiology, 33(1), 21–31. https://doi.org/10.1038/s41370-022-00462-5
[xl] F. C. Hsu, J. Taneja, J. Carvallo, and Z. Shah, “Frozen Out in Texas: Blackouts and Inequity,” The Rockefeller Foundation, April 14, 2021, https://www.rockefellerfoundation.org/insights/grantee-impact-story/frozen-out-in-texas-blackouts-and-inequity/.
[xli] Diana Mitsova et al., “Socioeconomic vulnerability and electric power restoration timelines in Florida: the case of Hurricane Irma,” Springer Nature, July 18, 2018, https://par.nsf.gov/servlets/purl/10066853.
[xlii] Raoul Lievanos and Christine Horne, “Unequal resilience: The duration of electricity outages,” Energy Policy 108 (September 2017): 201–211, https://www.sciencedirect.com/science/article/pii/S030142151730349X.
[xliii] Katherine Cox and Kim BoRin, “Race and income disparities in disaster preparedness in old age,” Journal of Gerontological Social Work 61, no. 7 (2018): 719–734, https://www-tandfonline-com.ezproxy.cul.columbia.edu/doi/full/10.1080/01634372.2018.1489929; Diane Smith and Stephen Notaro, “Personal emergency preparedness for people with disabilities from the 2006–2007 Behavioral Risk Factor Surveillance System,” Disability and Health Journal (2009), https://www-sciencedirect-com.ezproxy.cul.columbia.edu/science/article/pii/S1936657409000041?via%3Dihub.
[xliv] Hengfang Deng et al., “High-resolution human mobility data reveal race and wealth disparities in disaster evacuation patterns,” Humanities and Social Sciences Communications 8 (2021), https://www.nature.com/articles/s41599-021-00824-8.
[xlv] Alex B. Hill et al., “The Public’s Case Against DTE Energy: Extracting Profits, inducing health harms, and damaging democracy,” We The People Michigan with Michigan Environmental Justice Coalition and Public Accountability Initiative, 2022, https://wethepeoplemi.org/wp-content/uploads/2022/08/REPORT-The-Publics-Case-Against-DTE-20220613.pdf.
[xlvi] “Utility Redlining: Inequitable Electric Distribution in the DTE Service Area,” We the People Michigan, August 2022, https://wethepeoplemi.org/wp-content/uploads/2022/08/DTE-Utility-Redlining-V3_20220822-FINAL.pdf.
[xlvii] Ibid.
[xlviii] Ibid.
[xlix] V. Do et al., “Spatiotemporal distribution of power outages with climate events and social vulnerability in the USA,” Nature Communications 14, 2470 (2023), https://doi.org/10.1038/s41467-023-38084-6.
[l] S.C. Ganz, C. Duan, and C. Ji, “Socioeconomic vulnerability and differential impact of severe weather-induced power outages,” PNAS Nexus 2, no. 10 (October 2023), https://doi.org/10.1093/pnasnexus/pgad295; National Center on Disaster Preparedness, Columbia University, “Disaster Response and Equity: Reflecting on the Racial Disparities in Texas Power Outages,” March 27, 2023, https://ncdp.columbia.edu/ncdp-perspectives/disaster-response-and-equity-texas-power-outrages/.
[li] Helen Meier and Bruce Mitchell, “Tracing the Legacy of Redlining: A New Method for Tracking the Origins of Housing Segregation,” National Community Reinvestment Coalition, February 2022, https://ncrc.org/redlining-score/.
Most African countries today are faced with a dual challenge: how to industrialize and expand electricity access at the same time.
Artificial intelligence is driving a massive technological transformation that is already reshaping many aspects of daily life.
30 years ago last month, a brutal heatwave struck Chicago, killing more than 700 residents. As the city and much of the United States recently experienced another period of extreme heat, this anniversary serves as a reminder that heat remains one of the deadliest climate-related hazards — killing more people each year than hurricanes, floods and tornadoes combined — particularly for communities burdened by decades of disinvestment and structural barriers to health and safety.

Full report
Commentary by Qëndresa Krasniqi, Vivek Shastry, Alexandra Peek + 1 more • July 01, 2024