This website uses cookies as well as similar tools and technologies to understand visitors’ experiences. By continuing to use this website, you consent to Columbia University’s usage of cookies and similar technologies, in accordance with the Columbia University Website Cookie Notice.
This Energy Explained post represents the research and views of the author. It does not necessarily represent the views of the Center on Global Energy Policy. The piece...
As President Biden’s national security advisor, Jake Sullivan laid out a strategy for what he called a “foreign policy for the middle class.” Using the metaphor of a...
Please join the Women in Energy initiative at the Center on Global Energy Policy at Columbia SIPA for a public roundtable featuring Claire Steichen, Founder of Clear Strategy Coaching. The fast-evolving energy...
Event
• Online
About Us
We are the premier hub and policy institution for global energy thought leadership. Energy impacts every element of our lives, and our trusted fact-based research informs the decisions that affect all of us.
This Energy Explained post represents the research and views of the author. It does not necessarily represent the views of the Center on Global Energy Policy. The piece may be subject to further revision. Contributions to SIPA for the benefit of CGEP are general use gifts, which gives the Center discretion in how it allocates these funds. Rare cases of sponsored projects are clearly indicated.
For a full list of financial supporters of the Center on Global Energy Policy at Columbia University SIPA, please visit our website at Our Partners. See below a list of members that are currently in CGEP’s Visionary Circle. This list is updated periodically.
Almost 34 million American households were considered energy insecure in 2020 (the latest date such data were compiled by the US Energy Information Administration), with the majority foregoing food or life-saving medicine at least once in order to pay their utility bills.[1] High energy costs can lead households to leave their homes at unhealthy temperatures to avoid spikes in seasonal bills.[2] Many states require consumer protections like disconnection notices, payment plans, and seasonal shutoff moratoria in recognition of the important, sometimes life-saving value of electricity.[3] However, long-term solutions are needed for families who are consistently paying an outsized portion of their income toward their electric bills. Low-income discount programs offer differentiated rates to income-qualifying residential customers. (Discount programs are one among a range of approaches utilities are experimenting with, each having its advantages and challenges.[4])
For the 72% of Americans whose electricity is provided by private investor-owned utilities (IOUs),[5] energy costs are determined by a formal ratemaking process. State-level regulators (often referred to as public utility commissions or PUCs) review and approve utilities’ recoverable costs, profit, and the division of rates between customer classes (e.g., residential, commercial, and industrial customers). While this ratemaking process has historically been technocratic and based on relative cost-of-service, regulators are increasingly expanding their scope to achieve social and environmental policy goals as well. Low-income discount programs are one such example: qualifying households receive a credit on their bills based on their ability to pay. Discount programs are commonly funded by other utility ratepayers through on-bill public interest tariffs.[6] Twenty-six US states and the District of Columbia have implemented low-income discount programs, with broad variance in program type, eligibility thresholds, and subsidization levels.
Low-Income Discount Programs as an Affordability Approach
Broadly, there are four types of low-income discount programs:
Lifeline rates: a baseline volume of electricity is discounted to cover an eligible household’s basic necessities, with energy use in excess of the baseline charged at normal rates. For example, Utah offers a Low-Income Lifeline Program whereby qualifying households’ monthly bills are the sum of their electric service charge and a $13.95 lifeline credit.[7]
Straight discount models: bills are reduced by a set percentage or dollar amount for all eligible households. For example, the California Alternative Rate for Energy (CARE) program has a straight discount rate for utility customers who enroll in Low Income Home Energy Assistance Program (LIHEAP)—30–35% depending on which IOU a customer is served by.[8]
Percent of income payment plans (PIPPs): regulators decide on an acceptable energy burden (the percentage of customer’s household income that is spent on energy) and credit any amount exceeding that on each bill. For example, New Jersey’s PIPP is administered through a Universal Service Fund that provides a monthly credit on eligible customers’ electric and natural gas bills. The program’s goal is to ensure that households aren’t paying more than 6% of their gross income on both bills combined, which is the most commonly used energy burden cap.[9]
Tiered discount models: qualifying households are grouped into tiers based on income level and assigned a range of discounts, with the largest discount received by the lowest income group. For example, New Hampshire’s Electric Assistance Program (EAP) offers monthly electric utility bill discounts ranging from 5% to 86%, depending which of five tiers qualifying customers fall into.[10] All ratepayers support the EAP through a surcharge on their electric bills for system benefits.
Prevalence of Discount Programs Across US States
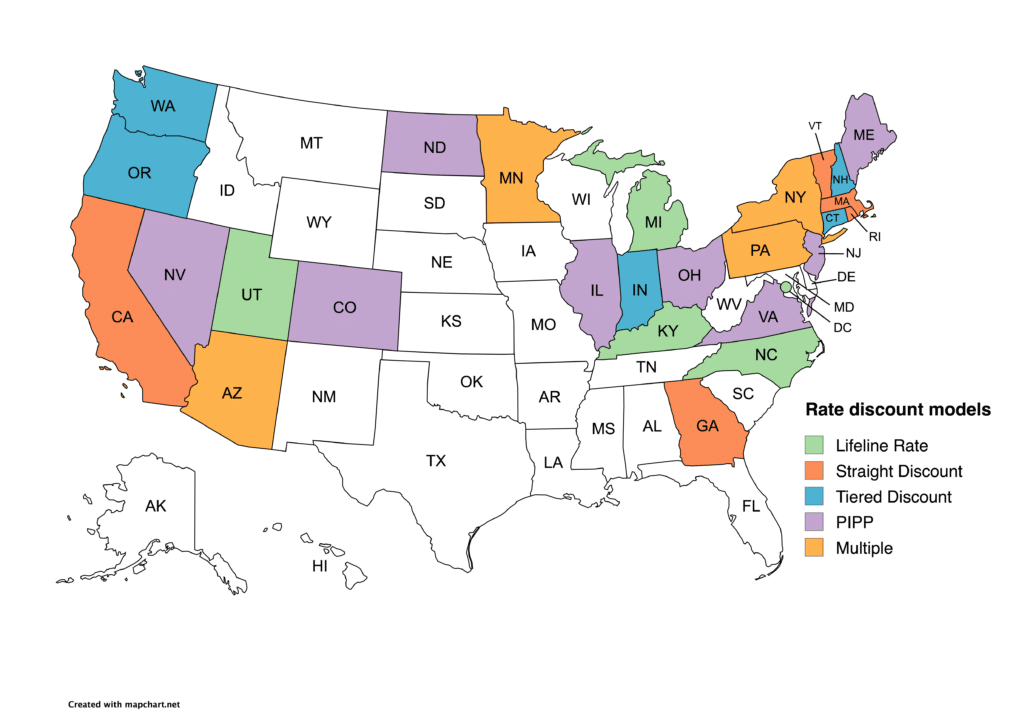
As noted, 26 state PUCs and the District of Columbia have approved the creation of low-income discount programs. The most common model is the percent-of-income payment plan (PIPP), which is the primary model in eight states (see Figure 1). The creation of low-income discount programs almost always follows explicit requirement from state regulators, but utilities can also design and implement them voluntarily, though they would still require PUC approval. In some cases, the state PUC determines the type of discount program required and subsequently directs each IOU to implement it, such as California’s straight discount model. In other states such as Pennsylvania, the PUC merely requires that utilities have low-income rate assistance, leaving the model selection and design to a utility’s discretion.[11]
Many states that do not have any discount programs also have high electricity rates, according to data from the US Energy Information Administration.[12] Of the 10 states with the highest average monthly electricity bills, only four have low-income discount programs. The rest—Hawaii (No. 1), Alabama (No. 3), Texas (No. 4), Louisiana (No. 5), Florida (No. 7), and South Carolina (No. 10)—do not subsidize rates, leaving low-income customers with high bills and occasional one-time emergency financial assistance from federally funded programs like LIHEAP.[13] The average household electric bill for these top 10 states is $164.91 per month, with Hawaii at $221.53/month.[14] In contrast, the 10 least expensive states have bills averaging 40 percent lower, at $99.62/month. Many of the priciest states are located in the South, where bills in summer months often far exceed the annual averages due to air conditioning, and such energy bill volatility can be especially challenging for customers on fixed incomes.
Figure 1: Low-income utility discount programs in US states
Source: Data compiled from relevant utility and state government agency websites.
Climate Change’s Effect on Utility Bills
Despite subsidies in some states for low-income discounts, with constantly increasing utility rates, over one-quarter of US households are experiencing energy insecurity, leading to economic hardship and potential lapses in service.[15] Sixteen percent of Americans were behind on their electricity bills.[16] In the wake of climate change, many utilities are transitioning away from fossil fuel-based generation in favor of renewable alternatives. The costs of building new generation, expanding transmission systems, and adapting aging infrastructure to be more resilient against climate change will all be embedded in rates and passed down to consumers. Energy costs for low- and medium-income households are expected to increase in the short and medium term (even as average costs may go down because of incentives for clean energy technologies), thereby increasing household energy burdens.[17]
Climate change will also act as a physical threat multiplier, with unhealthy to life-threatening coping mechanisms undertaken to afford higher bills. For example, prolonged exposure to abnormally hot temperatures caused more fatalities in 2021 than floods, hurricanes, and extreme cold combined.[18] Risks are especially acute for the elderly, children, and pregnant women.[19] Historically, politicians have made calls for more emergency funding through programs like LIHEAP during the peak of temperature extremes in summer and winter.[20] As extreme heat events become more common and severe with climate change, access to affordable, reliable electricity will save lives. By emphasizing the social implications of electricity rate design, utilities and regulators can proactively reduce disproportionate energy burdens among already disadvantaged communities.
Foundations and Individual Donors Anonymous Anonymous the bedari collective Jay Bernstein Breakthrough Energy LLC Children’s Investment Fund Foundation (CIFF) Arjun Murti Ray Rothrock Kimberly and Scott Sheffield
[1] US Energy Information Administration, “2020 Residential Energy Consumption Survey,” https://www.eia.gov/consumption/residential/data/2020/.
[4] Abigail Austin, Vivek Shastry, Emma Shumway, Qëndresa Krasniqi, and Diana Hernández, “Addressing Energy Insecurity via Utility Ratemaking,” Center on Global Energy Policy, Columbia University, August 19, 2024, https://www.energypolicy.columbia.edu/publications/addressing-energy-insecurity-via-utility-ratemaking/.
[13] Andrea Nishi, Diana Hernández, and Michael Gerrard, “Energy Insecurity Mitigation: The Low Income Home Energy Assistance Program and Other Low-Income Relief Programs in the US,” Center on Global Energy Policy, Columbia University, November 15, 2023, https://www.energypolicy.columbia.edu/publications/energy-insecurity-mitigation-the-low-income-home-energy-assistance-program-and-other-low-income-relief-programs-in-the-us/.
[16] Qëndresa Krasniqi, Vivek Shastry, Alexandra Peek, and Diana Hernández, “Utility Policies and Practices to Alleviate US Energy Insecurity,” Center on Global Energy Policy, Columbia University, June 2024, https://www.energypolicy.columbia.edu/publications/utility-policies-and-practices-to-alleviate-us-energy-insecurity/.
[19] Gabriella Y. Meltzer, Pam Factor-Litvak, Julie B. Herbstman, Blair J. Wylie, and Diana Hernández, “Indoor Temperature and Energy Insecurity: Implications for Prenatal Health Disparities in Extreme Heat Events,” Environmental Health Perspectives 132, no. 3 (March 2024): 035001, https://doi.org/10.1289/EHP13706.
[20] Liv Yoon and Diana Hernández, “Energy, Energy, Read All about It: A Thematic Analysis of Energy Insecurity in the U.S. Mainstream Media from 1980 to 2019,” Energy Research & Social Science 74 (April 1, 2021): 101972, https://doi.org/10.1016/j.erss.2021.101972.
This Energy Explained post represents the research and views of the author. It does not necessarily represent the views of the Center on Global Energy Policy. The piece...
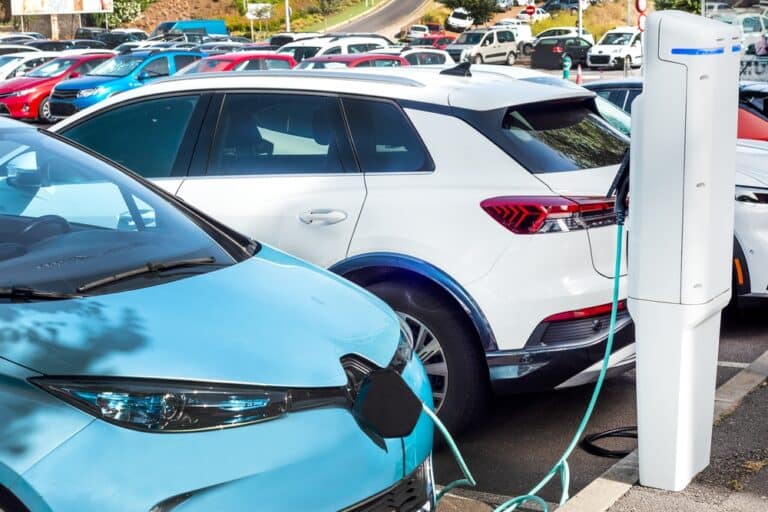
Vehicle-grid integration (VGI) refers to the use of smart technologies to coordinate the charging operations of electric vehicles (EVs) to avoid negative impacts on the electric grid associated...
The Just Energy Transition Partnership (JETP) framework[1] was designed to help accelerate the energy transition in emerging market and developing economies (EMDEs) while embedding socioeconomic[2] considerations into its planning and implementation.
Commentary
by Gautam Jain & Ganis Bustami• March 03, 2025
About one in four American households experience some form of energy insecurity. Within this group, Black, Indigenous, Latine, low- and moderate-income (LMI), and other disadvantaged communities face a disproportionately higher burden.